Statistical process control in pcb production

Quality was born as metrological control of the product and this concept developed in the 90s as basis of the first versions of the certifiable ISO 9001 standard.
Over time, the quality standards have indicated not only economic opportunity to decrease the level of quality control, as "autopsy of pieces out of accepted tolerance", implementing logics that shifts the focus from product to process, with a preventive approach respecting the production.
Cistelaier has adopted statistical control of process variables since several years and the internal laboratory constantly monitors the trend of the main values through over 60 process analyses of which the trends and historical values of capacity are known.
This logic, similar to that used for the validation of special processes (ie processes for which the results of the process are not directly measurable), makes use of more advanced statistics than classical quality control, statistics focused on verifying the capacity of the process, as a statistical expression of the level of output with respect to the maximum tolerance required by the product specifications.
The studies are based on the normal or Gaussian distribution to verify if the values of the measured sample, applying the hypothesis of normality of the same, represent a process curve compatible with the tolerance range expected for this value.
In this way, unlike the classical measurement, which determines whether a series of values is within the given tolerance or not, the system will be able to express the probability with which the process values will be part of the extremes of tolerance and to foresee the possible percentage of products not conforming to it.
Going into the field of statistics, while wanting to maintain a popular approach, we can say that the indexes that represent and describe these behaviors are, in particular, Cp and Cpk.
Descriptively, we can define that Cp describes the width of the Gaussian around the average value, while that Cpk represents the centering of the process with respect to the extremes, always being Cpk ≤ Cp.
In the following example, two sets of values of 25 measures on a theoretical target of 1.5 ± 0.1 are represented.
It is possible to see how the two series of values, while both having 100% of the measurements within the tolerance, highlight process capabilities that are different from the expected measurement and how, for the second one, a percentage of rejected pieces is predictable.
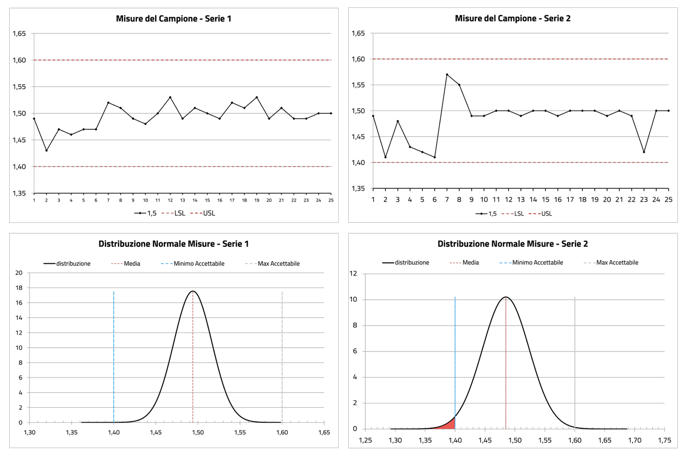
It can be observed that the capacity indices of the two Series are different:
| Series 1 | Series 2 |
| Cp and Cpk > 1,33 | Cp and Cpk < 1 |
| % Expected waste 0% | % expected waste 2% |
The knowledge and interpretation of these values allows to better organize the quality control frequencies and to understand why it is not possible to 100% avoid some control phases during the production of PCBs (in particular, the inner layers’ automatic optical control and electrical test).
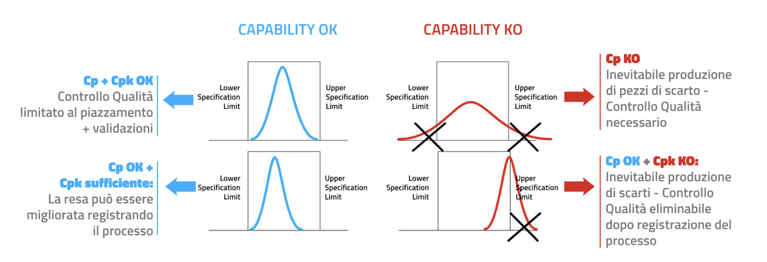
Based on the process analysis, different cases can be found:
These conditions determine differentiated interventions to bring the process back to optimal conditions.